
In the realm of spreadsheet tools, Google Sheets is a go-to platform for organizing and analyzing data. One of its standout features, conditional formatting, acts as a virtual artist, transforming your data into a visual masterpiece. In this guide, we’ll demystify conditional formatting, breaking it down into bite-sized, easy-to-understand pieces for everyone, regardless of your technical background.
What is Conditional Formatting?
Imagine your data as a canvas, and you, the artist, want to highlight specific elements to tell a compelling story. Conditional formatting is your palette of colors, allowing you to paint your data with rules that automatically change the appearance of cells based on specified conditions.
Basic Conditional Formatting Rules
Let’s start with the basics:
1. Highlight Cells Rules
- Greater Than/Less Than: You can highlight values that are greater or less than a specific number, making important figures pop out.
- Between: Use this to emphasize values falling within a range, like monthly sales within a target range.
- Equal To: Make specific values stand out by highlighting cells that match a given value.
2. Text Rules
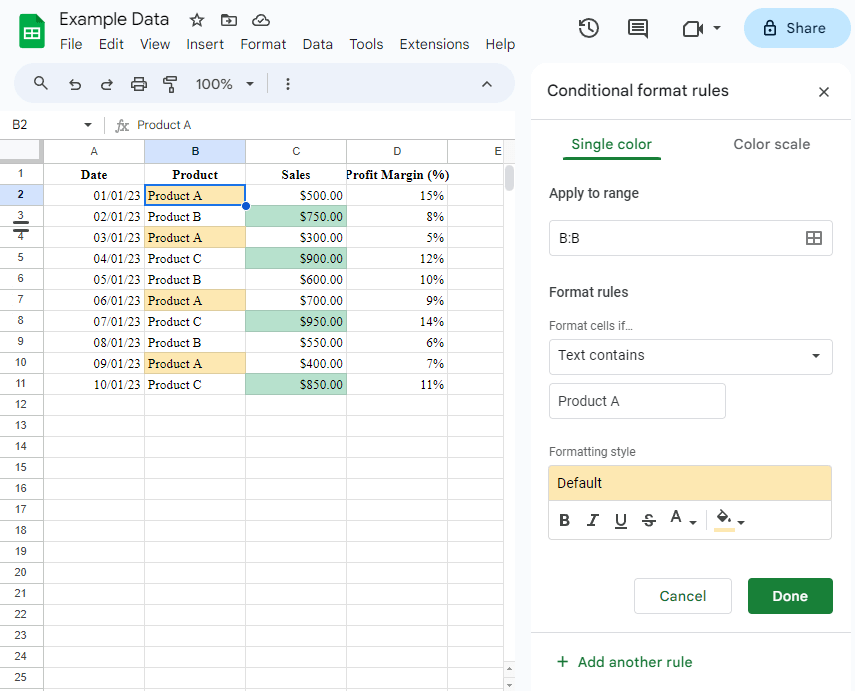
- Text Contains: Apply formatting based on whether a cell’s text contains a certain keyword. Ideal for sorting through large amounts of text data.
- Text Starts/Ends With: Useful when working with lists, you can highlight cells based on their starting or ending characters.
3. Date Rules
- Date Is: Perfect for managing schedules or timelines, this rule lets you format cells based on a specified date.
- Date Occurs: Highlight dates that fall within a specific timeframe, such as all dates in the next 7 days.
Advanced Conditional Formatting Techniques
Once you’ve mastered the basics, it’s time to step up your game. Here are some advanced techniques:
1. Custom Formula Rules
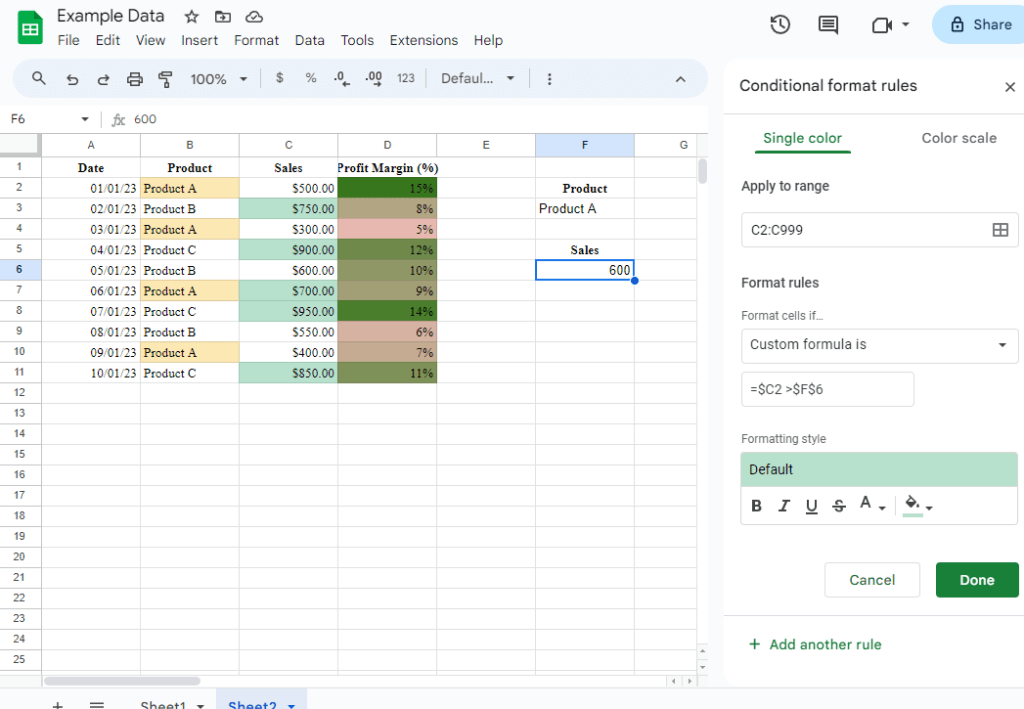
This is where conditional formatting truly becomes an art form. You can create custom formulas that cater to your unique needs. For example, you could highlight any products called “Product A”
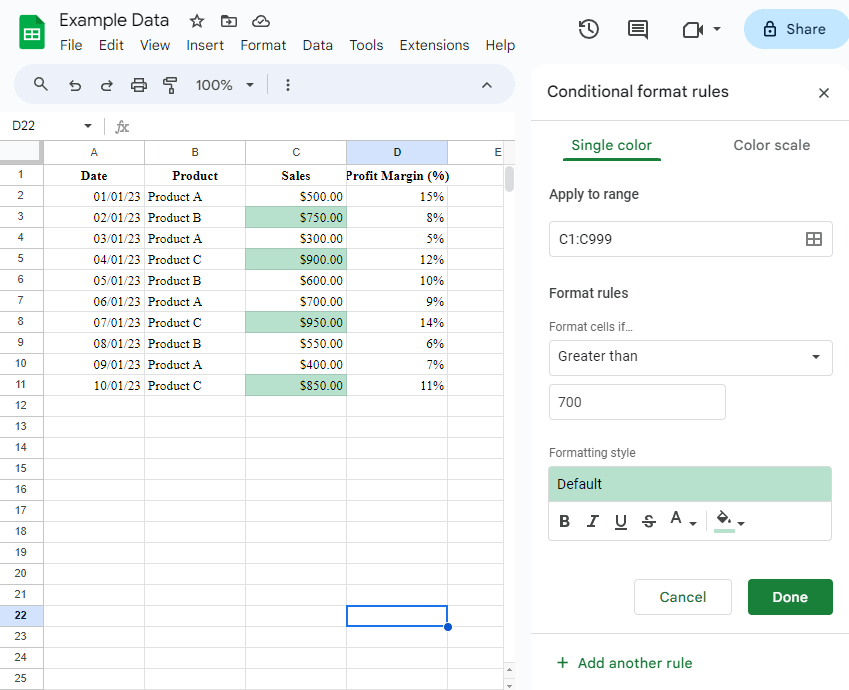
Or maybe you want to know which sales are over $700.
You also could instead of typing these values, you could refer to a cell. Maybe F6 will contain the sale value and F3 will contain the product name
2. Color Scales
Color scales are like a heat map for your data. They gradually apply colors based on the data’s value. It’s perfect for visualizing data trends and comparisons.
This would be useful in the margin column. You could select a pale red as the lower end and then a green as the higher end and you can visually see the greener the square the higher the profit margin. This also makes it easier to pick out what items need to be looked into and potentially scrapped if not very profitable.

Tips for Effective Conditional Formatting
Here are some tips to ensure your conditional formatting is both functional and aesthetically pleasing:
- Use colors wisely: Avoid overwhelming your spreadsheet with too many colors. Stick to a simple color scheme that complements your data.
- Test your rules: Before applying complex rules, test them on a small dataset to ensure they work as expected.
- Combine rules: You can apply multiple rules to a single cell or range, allowing you to create intricate formatting patterns.
Where to Find Conditional Formatting in Google Sheets
To access conditional formatting in Google Sheets, select the cells you want to format, go to Format in the top menu, and choose Conditional formatting.
Conclusion
Google Sheets’ conditional formatting is your artistic tool to visually represent data, making it easier to analyze and understand. Whether you’re a novice or an experienced user, these techniques can help you turn your data into a work of art. So go ahead, experiment, and let your data tell a vivid story!
Remember, while mastering conditional formatting might take some practice, the results are worth it. Happy data visualization!
Hey, it’s Nicole! A tech enthusiast with over two decades of immersive exploration into the ever-evolving world of technology. From delving into the intricacies of AI and navigating the realm of apps to unraveling the mysteries of blockchain, dissecting gadgets, and indulging in the world of gaming – my journey has been nothing short of exhilarating.
My mission? It’s simple: I’m here to demystify technology and make it accessible to everyone. Whether you’re a tech novice taking your first steps into the world of AI or a seasoned enthusiast seeking the latest gadgets, consider me your guide.
Join me on this thrilling expedition through the digital landscape, where we’ll explore, learn, and conquer together. Let’s transform the world of tech into your personal playground!